American Airlines Business Model, Economics, and Risk Profile
- ohaiat
- 6 בפבר׳
- זמן קריאה 14 דקות
עודכן: 8 בפבר׳
American Airlines today is a scale network carrier with one of the largest hub‑and‑spoke systems in the world, anchored in mega‑hubs like Dallas/Fort Worth, Charlotte, and Miami and leveraged through the oneworld alliance for global reach. Its modern structure is the product of decades of consolidation and restructuring, most notably the 2011 AMR bankruptcy and the 2013 merger with US Airways, which created the current American Airlines Group and cemented its position among the “Big Three” U.S. airlines.
Economically, the company is best understood as a portfolio of four business models rather than a single monolithic airline: a large, low‑margin scheduled passenger business; a high‑margin loyalty and co‑branded credit‑card franchise; a growing stream of ancillary revenues (bags, seats, fees); and a small but capital‑light cargo operation. Recent financials show record revenue but thin profitability: core flying has restored scale but struggles to consistently earn its cost of capital, while loyalty and ancillaries increasingly carry the margin and cash‑flow burden.
The risk backdrop is demanding. American faces the usual airline headwinds—demand cyclicality, fuel and wage inflation, competitive capacity, and regulatory/ESG pressure—overlaid on a still‑heavy balance sheet that amplifies volatility. Management’s response centers on three pillars: improving operational reliability and hub efficiency, deepening high‑margin revenue via AAdvantage and premium products, and using free cash flow to steadily delever. The crux of the investment question is whether this strategy can turn American’s undeniable scale and ecosystem into durable, through‑the‑cycle value creation rather than just survival through the next downturn.
Company Background
American Airlines Group Inc. is the holding company for American Airlines, one of the world’s largest network carriers headquartered in Fort Worth, Texas. The company today operates a hub-and-spoke system anchored in major U.S. metropolitan areas and participates in the one world alliance, giving it global reach through both its own metal and partner carriers.
The airline traces its roots back to the 1920s, when a loose collection of small carriers flew U.S. airmail routes that were later consolidated under the American Airways banner and ultimately rebranded as American Airlines. Over subsequent decades, American evolved from a regulated domestic trunk carrier into a global airline, helped by deregulation in 1978 and successive waves of fleet modernization, computer-based reservations, and yield-management tools that shaped its modern network-carrier DNA.
A pivotal inflection point came after the financial crisis, when American’s parent, AMR Corporation, filed for Chapter 11 bankruptcy protection in 2011, reflecting years of high costs and an uncompetitive balance sheet. In parallel, US Airways—itself a product of multiple mergers and prior bankruptcies—was still working through its own restructuring, which set the stage for a combination framed as the only credible path to scale and long-term viability for both airlines.
In 2013, AMR and US Airways Group completed their merger to form American Airlines Group Inc., at that time the largest airline in the world by traffic, with AMR shareholders owning roughly 72 percent of the new company and US Airways shareholders 28 percent. The combined airline retained the American Airlines name and branding but adopted much of US Airways’ management team, including CEO Doug Parker, and agreed to divest slots at key constrained airports as part of an antitrust settlement with the U.S. Department of Justice.
The post-merger integration extended beyond logos and livery to the dense, operationally complex process of aligning fleets, labor contracts, IT systems, and hub strategies, a process that effectively ran through the mid-2010s. By 2015, the US Airways brand had disappeared, American Airlines Group had joined the S&P 500, and the company had largely unified operations under a single operating certificate, creating a scaled but highly leveraged network carrier entering the next industry cycle.
Today, American’s network is built around a broad set of hubs including Dallas/Fort Worth, Charlotte, Miami, Chicago, Phoenix, Philadelphia, Los Angeles, New York, and Washington, D.C., giving it an especially strong position in domestic connectivity and U.S.-Latin America flows. The hub-and-spoke architecture is central to its strategy: concentrating flights at a handful of major airports allows American to aggregate demand from smaller cities, offer a high number of one-stop itineraries that would be uneconomic as point-to-point routes, and feed alliance partners across more than 900 destinations worldwide.
The pandemic years exposed both the strengths and fragilities of this model, with demand collapsing in 2020 and then rebounding unevenly across leisure and corporate travel, forcing American to raise liquidity and accept a materially higher debt load. Coming out of the crisis, the carrier has focused on three intertwined themes: rebuilding demand with an emphasis on premium customers, investing in a younger and more efficient fleet, and gradually repairing the balance sheet while operating in an industry where mid-single-digit net profit margins are increasingly seen as a structural ceiling rather than a cyclical trough.
Against this backdrop, American’s 2025 performance - record revenue of roughly $54.6 billion but relatively thin net income - captures the tension at the heart of its business: it is a scale leader with a powerful network and alliance footprint, yet it operates in a structurally low-margin, capital-intensive industry with limited room for error. That context frames a core analytical question : whether American’s current strategy can turn its scale, hubs, and loyalty ecosystem into durable, through-the-cycle economic value for shareholders.
American Airlines – Key Milestones
1920s–1930s – Mail carrier roots
Built from a patchwork of small airmail operators that consolidate into American Airways, which is later renamed American Airlines as it pivots from mail to passengers.
1978 – Deregulation era
U.S. airline deregulation ends tight government control of routes and fares, pushing American to embrace hub-and-spoke flying, computerized reservations, and yield management to stay competitive.
2011 – Chapter 11 restructuring
AMR Corporation, American’s parent, files for bankruptcy after years of high costs and a strained balance sheet, setting up a strategic reset and eventual industry consolidation.
2013 – Merger with US Airways
AMR and US Airways combine to form American Airlines Group Inc., creating the world’s largest airline by traffic at the time and triggering a multi-year integration of fleets, systems, and cultures.
2020–2021 – Pandemic shock
Global travel demand collapses, American grounds large portions of its fleet, raises emergency liquidity, and exits the crisis with materially higher leverage but preserved scale.
2023–2025 – Recovery with thin margins
Traffic and capacity rebound, revenue reaches record levels, and management pivots to three themes: operational reliability, loyalty and premium customer monetization, and gradual deleveraging in a structurally low-margin industry.
The modern airline is no longer just a collection of planes and routes, but a portfolio of economic engines with very different margin and capital profiles. To see whether American’s model can genuinely create value, we need to move beyond the history and dissect its current revenue streams - identifying which businesses reliably earn their cost of capital and which merely absorb it.
Revenue Streams: American’s Four Economic Engines
Although American reports a single consolidated airline segment, its revenue base falls into a handful of distinct economic buckets. Scheduled passenger flying still dominates the top line, but loyalty partnerships, ancillary products, and cargo contribute meaningfully to margin and cash generation. Thinking about American as a portfolio of these revenue engines helps clarify where the business truly earns its keep.
Scheduled Passenger Revenue (Core Flying)
Scheduled passenger flying is the backbone of American’s income statement, accounting for the overwhelming majority of its operating revenue in a typical year. Within that total, domestic routes provide the largest share, while long-haul international flying across the Atlantic, Latin America, and the Pacific adds a second, more yield-sensitive layer to the franchise. Economically, what looks like “one” business is better understood as a portfolio of sub-businesses—short-haul domestic, long-haul international, and regional feed—each exposed to different demand patterns, competitive sets, and cost structures.
At its core, scheduled passenger revenue is driven by three levers: how much capacity American flies, how full that capacity is, and what it earns per unit of traffic. Capacity is measured in available seat miles, and the company’s hub-and-spoke network allows it to concentrate that capacity into banks of flights at key hubs, stitching together smaller spoke cities into a dense web of one-stop itineraries. Load factor—how many of those seats are actually filled—reflects both the underlying demand on each route and the airline’s ability to match schedules and frequencies to that demand. The third lever, yield, captures how much revenue American earns for each passenger mile, which tends to be higher where it serves business-heavy trunk routes, premium cabins, and constrained international gateways, and lower on price-sensitive domestic and leisure flows.
The margin profile of this business is shaped by a cost base that is both large and only partially controllable. Fuel and labor sit at the top of the expense stack, meaning profitability is highly sensitive to oil prices, wage agreements, and the availability and cost of pilots and crew. Network and fleet decisions—stage length, aircraft gauge, and utilization—further influence unit costs: flying larger, more efficient aircraft longer distances with high utilization can dilute cost per seat mile, while fragmented, irregular flying on smaller jets pushes it up. Because these economics vary by geography and cabin, the same aircraft type can generate very different returns depending on whether it is deployed on a high-yield transcontinental or a low-fare domestic route with heavy low-cost-carrier competition.
From an investor’s perspective, scheduled passenger revenue is the line item that justifies American’s massive capital investment in aircraft, airport facilities, and IT infrastructure, as well as its fixed commitments to labor and leases. Yet it is also the part of the business most exposed to macro swings, competitive capacity decisions, and operational disruptions, which can compress margins quickly. That tension is central to the rest of your essay: the core flying operation is indispensable for scale and network relevance, but on its own it is a structurally low-margin, capital-intensive activity whose ability to consistently earn its cost of capital is open to debate.
Loyalty and Co-Branded Credit Cards
Beneath the visible network of planes and routes sits a more abstract but often more profitable engine: the AAdvantage loyalty program and its associated co-branded credit cards. In this business, American is effectively selling miles, status, and access rather than transportation, monetizing cardholder
Macro and Industry Risks: Mitigation Strategies
American’s management isn’t passive about these external pressures. While no airline can fully insulate itself from macro forces, the company deploys a mix of financial, operational, and strategic tools to manage them. Here’s how each risk is addressed, with varying degrees of effectiveness.
Demand Cyclicality and Shock Risk
Hedging demand volatility:
American maintains a multi-year liquidity buffer—cash and short-term investments—to weather demand drops without forced asset sales or emergency financing. Post-COVID, this proved critical as the carrier drew down reserves while securing government aid. For regional shocks (e.g., geopolitical events), American uses scenario planning and flexible network adjustments, such as suspending low-yield routes or shifting capacity to resilient domestic leisure markets.
Limitations: Fixed costs still dominate, so prolonged downturns inevitably erode margins. The strategy buys time but doesn’t eliminate cyclicality.
Fuel Price and Cost Inflation Risk
Fuel hedging program: American hedges a portion of its jet fuel needs (typically 20–50% over 12–24 months) using swaps, collars, and futures to cap exposure to oil spikes. This smoothed P&L impacts during the 2022 energy surge but introduces mark-to-market volatility if prices fall. Beyond hedging, fleet modernization—adding fuel-efficient narrowbodies and widebodies—lowers structural CASM ex-fuel by 10–15% per generation.
Capacity and pricing discipline: Management commits to “prudent” capacity growth (3–5% annually) tied to yield trends, avoiding the oversupply traps that crushed margins in past cycles. Collective industry coordination happens informally through investor pressure and earnings calls, though it’s far from perfect.
Limitations: Hedging is never perfect—under-hedging exposes earnings to spikes, over-hedging to opportunity costs. Wage inflation from union contracts remains largely non-negotiable.
Capacity Discipline and Competitive Pressure
Network optimization: American counters rivals by focusing capacity on high-yield markets (premium domestic, Latin America) and leveraging oneworld alliances/joint ventures for long-haul scale without full incremental costs. Tools like dynamic pricing and revenue management systems help protect yields on competitive routes.
Product differentiation: Investments in premium cabins, Wi-Fi, and lounge access aim to win back corporate accounts lost to Zoom and low-cost carriers. The goal is to shift mix toward less price-sensitive demand.
Limitations: Rivals’ decisions are exogenous, and ULCC growth on sunbelt leisure routes remains a persistent yield drag.
Regulatory, Policy, and ESG Headwinds
Proactive compliance and advocacy: American engages regulators early on fee rules, refund policies, and slot approvals, often self-imposing standards (e.g., no change fees for most fares) to preempt mandates. On ESG, the company targets net-zero emissions by 2050 via sustainable aviation fuel (SAF) purchases and efficiency projects, positioning itself as a “first mover” to shape policy rather than react.
Lobbying and alliances: As part of Airlines for America and oneworld, American pushes back collectively on punitive rules, such as carbon taxes or alliance blocks.
Limitations: Politics is unpredictable—“junk fee” crackdowns or SAF mandates could still compress ancillaries or raise costs faster than peers.
Overall, American’s toolkit emphasizes resilience (liquidity, hedging) over immunity, with a heavier focus on execution than structural de-risking. This approach has stabilized the business post-COVID but leaves leverage and margin fragility as enduring investor concerns. Next, operational risks dig into company-specific vulnerabilities like hubs and labor.
Yes, and this is where your essay can move from “here are the risks” to “here is how capable management seems in handling them.” Below are concise, memo‑style paragraphs for each risk group, mirroring the macro section you liked.
Operational and Network Risks – And How American Manages Them
Hub concentration, weather, and disruption
American’s fortress hubs at Dallas/Fort Worth (DFW), Charlotte, and Miami are profit centers but also points of failure: storms or ATC constraints at a hub ripple across the network. To reduce this vulnerability, American is redesigning DFW’s bank structure—moving from nine tightly packed banks to thirteen more evenly spread across the day—and adjusting block times to cut down delay propagation and misconnects. The carrier is also investing in terminal expansion, baggage systems, and gate infrastructure at DFW, which handles over 930 departures on peak days and roughly 100,000 daily connecting customers.
These changes aim to trade a bit of theoretical connectivity and utilization for more reliable operations, especially during irregular operations.
Labor, staffing, and reliability
American’s network depends on highly coordinated pilot, cabin crew, and ground operations, all under union contracts. Recent years saw wage step‑ups and tight pilot markets across the industry, pressuring unit costs and creating staffing bottlenecks. Management’s response mixes long‑term contracts (locking in labor peace at higher wages), schedule smoothing (reducing peak‑day strain), and technology investments in crew planning and disruption management.
The company’s messaging has increasingly prioritized “running a reliable airline” as a foundation for premium revenue and loyalty, rather than chasing maximum short‑term capacity. The risk is that cost growth from these moves (higher wages, added buffers) outpaces the revenue premium they unlock;
Balance Sheet and Financial Risks – And the Deleveraging Playbook
High leverage and refinancing risk
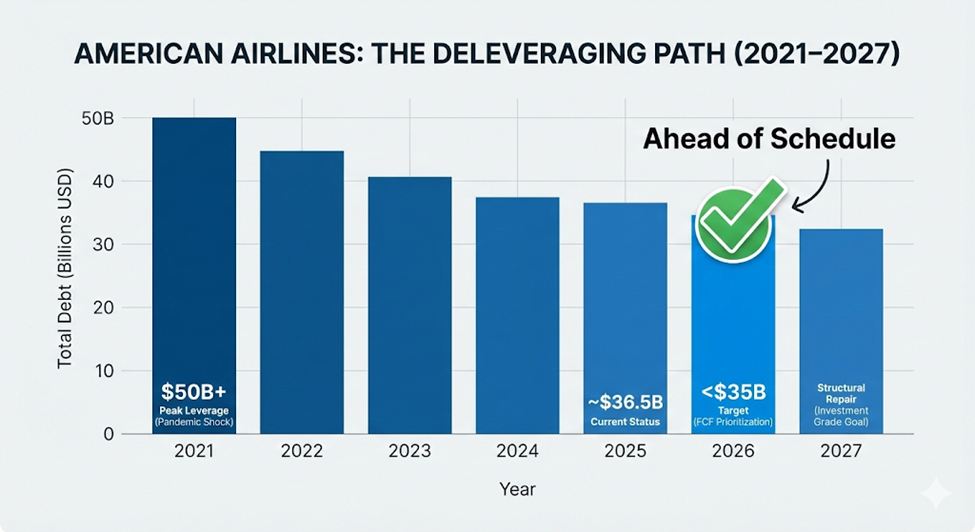
American still carries the highest leverage among the Big Three, with total debt around 36–37 billion dollars at year‑end 2025—down from a peak above 50 billion but still heavy. This magnifies normal airline volatility: small swings in revenue or fuel can translate into outsized changes in free cash flow and equity value. Management’s core mitigation is a multi‑year deleveraging plan: using operating cash flow and over 1 billion dollars of annual free cash flow (2025) to pay down principal, targeting total debt below 35 billion dollars by 2027 - and now signaling they may reach that in 2026.
American also emphasizes flexibility: it reports more than 14 billion dollars in unencumbered assets and over 12 billion dollars of additional first‑lien borrowing capacity, providing a liquidity backstop if markets tighten. The trade‑off is that aggressive debt reduction competes with fleet capex, product investment, and potential shareholder returns;
Strategic Status | Total Debt (Year-End) | Year |
Peak Leverage (Pandemic Shock) | ~$50B+ | 2021 |
Current Status (Record Revenue Phase) | ~$36-37B | 2025 |
Accelerated Goal (FCF Prioritization) | Target <$35B | 2026 |
Structural Repair (Investment Grade Goal) | Long-term Target | 2027 |

Thin margins, cost of capital, and FCF focus
With consolidated operating margins in the low single digits and interest expense still elevated, American’s ability to consistently earn its cost of capital remains debatable. Management has explicitly shifted messaging toward free cash flow as the key metric, guiding to more than 2 billion dollars of FCF in 2026, supported by moderate capex and disciplined capacity. They are also leaning into higher‑margin revenue streams - premium cabins and loyalty - where active AAdvantage accounts grew 7% and co‑branded card spend 9% year over year in Q3 2025.
In practice, this means American is trying to “grow into” its capital structure rather than recapitalize it via equity. The risk for investors is that one or two bad years (from macro, fuel, or operational disruption) could derail the deleveraging path and force more drastic measures.
Business‑Model Specific Risks – And Targeted Responses
Scheduled passenger flying
Risk: structural competition and cost creep on a low‑margin, capital‑intensive base.
Mitigation: American is focusing flying where its hubs are strongest—DFW, CLT, MIA—instead of fighting high‑cost share wars in New York and Los Angeles, aiming to maximize hub economics and defend yields. Network optimization, schedule smoothing at key hubs, and a tilt toward premium demand (upgauging, improved cabins, better lounge network) are meant to lift unit revenue while keeping capacity growth disciplined. The open question is whether these tactics can offset rising labor and infrastructure costs over a full cycle.
Loyalty and co‑branded cards
Risk: regulatory and interchange‑fee changes that could undermine the high‑margin loyalty economics. Proposed settlements and potential federal action on interchange fees threaten to reduce the attractiveness and economics of premium rewards cards, which underpin AAdvantage’s co‑brand revenue. There is also political discussion of capping credit‑card interest rates, which could further pressure issuer profitability and their willingness to pay for miles.
Mitigation: American is leaning into the non‑monetary value of its program - status, upgrades, seat access, lounges - so that card demand is not purely a function of points economics. It is also broadening partner bases and earn/burn opportunities (retail, travel partners), which can diversify away from pure interchange economics. Analysts expect any major interchange impact only after 2027, giving airlines some time to adjust pricing and program design.
Ancillary revenues
Risk: customer backlash and “junk fee” regulation targeting bag fees, family seating charges, and opaque add‑ons. Political and regulatory scrutiny could force more transparent pricing, caps, or outright bans on certain fee types, crimping one of the highest‑margin revenue layers.
Mitigation: American is gradually moving toward clearer fare families and upfront disclosure of key ancillaries, making them look more like optional product tiers than hidden charges. Linking ancillaries to loyalty perks (e.g., free bags for elites, preferred seats for certain cardholders) can also recast them as benefits rather than penalties, while preserving monetization on non‑loyalty customers. The risk remains that regulators impose broad rules that apply regardless of how well American self‑polices.
Cargo
Risk: exposure to trade cycles and long‑haul capacity swings, with limited strategic attention because cargo is a small slice of revenue.
Mitigation: American runs cargo largely as an incremental business on top of the passenger network, using partnerships and digital platforms to optimize load factors and yields without large dedicated-fleet bets. This minimizes downside risk, but also means cargo is unlikely to be a major buffer in a downturn; it’s more of a “nice extra” than a core risk management lever.
Taken together, American’s approach to risk management is pragmatic rather than transformative: it tweaks hubs, leans into loyalty, and pays down debt, but still leaves investors exposed to an industry where thin margins, high fixed costs, and policy shifts can quickly overwhelm even well‑intentioned strategy.
American Airlines: 2025 Financial Results by Segment (Revenue & Profit/Loss)
American Airlines does not report separate profit/loss (operating income) for its three GAAP segments - Passenger, Cargo, and Other. All costs (fuel, labor, maintenance, etc.) are allocated at the consolidated level, making true segment P&L unavailable in public filings.
However, here's the closest breakdown using Q4/full-year 2025 revenue data plus qualitative margin characterization for each (drawn from management commentary, industry norms, and prior analysis).
Q4 2025 Segment Performance (Revenue Only)
Total operating revenue: $14.0 billion (+2.5% YoY; -$325M government shutdown hit).
Key P&L Notes | Est. Margin Profile | % of Total | YoY Change | Q4 Revenue | Segment |
Drove topline via premium (+12% managed corporate); unit revenue -2.5% ex-shutdown. Cost headwinds (CASM +3.8%) eroded profitability. | Low (~2-3% implied contribution to consolidated 3.2% op. margin) | 90.4% | +2.1% | $12.7B | Passenger |
Stable volumes; lagged estimates. Positive contributor but too small to move needle. | Moderate-High (incremental margins 20-40%; belly space leverage) | 1.6% | +2.8% | $226M | Cargo |
AAdvantage/card growth (enrollments +7%, spend +8-9%). Key profit stabilizer. No isolated P&L. | High (loyalty margins historically >50-70%; cushioned group results) | 7.9% | +7.4% | $1.1B | Other |
Capital Intensity | Implied Margin Profile | Revenue Share | Economic Engine |
High (Aircraft/Fuel/Labor) | Low (~2-3%) | 91% | Passenger Flying |
Low (Digital/Partnerships) | High (>50-70%) | 8% | Loyalty & Ancillary |
Low (Belly space leverage) | Moderate (20-40% incremental) | ~1-2% | Cargo |
Consolidated Q4 P&L
Operating income $449M (3.2% margin, down 5.1 pts YoY); net income $99M GAAP ($0.15/share).
Full-Year 2025 Segment Performance (Revenue Only)
Total operating revenue: $54.6 billion (record).
Key P&L Notes | Est. Margin Profile | YoY Trends | % of Total | Est. Full-Year Revenue | Segment |
Scale restored but TRASM -1.4%, CASM inflation crushed margins. No isolated P&L. | Low (~2.7% consolidated op. margin heavily Passenger-driven) | Record; capacity rebound | ~91% | Passenger | |
Belly leverage; trade-stable. Modest positive but immaterial. No isolated P&L. | Moderate-High (20-40% incremental) | Normalized post-spike | 1-2% | ~$0.8-0.9B | Cargo |
Record AAdvantage metrics; offset flying weakness. No isolated P&L. | High (>50% loyalty margins) | Mid-teens implied | ~7-8% | ~$4.1-4.5B | Other |
Consolidated Full-Year P&L : Operating profit $1.4B (2.7% margin); net income $111M GAAP ($0.17/share); adjusted net $237M ($0.36/share).
Taken together, American Airlines looks less like a single airline and more like a bundle of four distinct economic engines strapped to the same balance sheet, each with its own growth and risk profile. The scheduled flying business provides indispensable scale and network relevance but remains structurally low‑margin and exposed to macro shocks, while loyalty, ancillaries, and cargo supply the higher‑return cash flows that increasingly determine whether the group creates or destroys value over time. Against a backdrop of thin margins, elevated leverage, and intensifying regulatory and environmental scrutiny, management’s strategy of prioritizing reliability, premium and loyalty economics, and disciplined deleveraging is a rational attempt to bend the curve in shareholders’ favor. Whether that proves enough will ultimately be judged not in any single strong year, but in American’s ability to sustain acceptable returns on capital across a full cycle in an industry that has rarely rewarded optimism for long


תגובות