American Airlines: Business Model, Economics, and the Q1 2026 Reality
- ohaiat
- May 3
- 5 min read
This is an update to the previous post discussed about American Airlines. This pose is based on Q1 2026 FS.
Executive Summary
American Airlines (AAL) enters 2026 as a scale leader with a powerful global network, yet it remains caught in a high-leverage, low-margin trap. While the company achieved record revenue in 2025, consolidated operating margins remain incredibly lean.
The "real" American Airlines is a tale of two businesses:
The Passenger Engine: Accounts for the vast majority of revenue but operates with high capital intensity and low margins (~1-2%).
The Loyalty Engine (AAdvantage): A high-margin powerhouse (>50%) that serves as the critical profit stabilizer for the entire company.
Management's strategy moving forward hinges on prioritizing operational reliability over raw capacity growth, monetizing premium/loyalty customers, and aggressively paying down debt to below $35 billion. For investors, the bull case rests on the loyalty program's growth and successful deleveraging, while the bear case remains tied to fuel volatility, labor inflation, and the airline's heavy debt load.
Company Background & Key Milestones
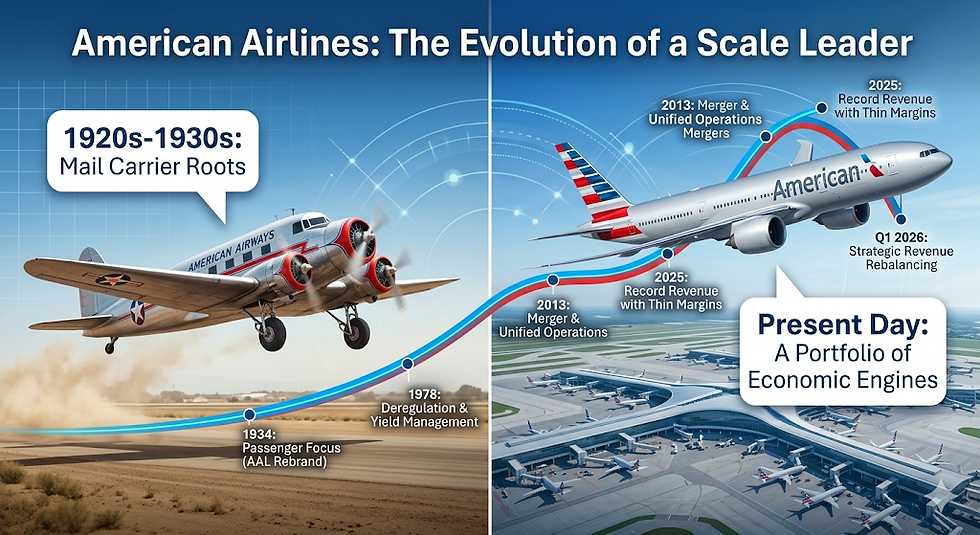
American Airlines today is a scale network carrier with one of the largest hub‑and‑spoke systems in the world, anchored in mega‑hubs like Dallas/Fort Worth, Charlotte, and Miami and leveraged through the oneworld alliance for global reach. Its modern structure is the product of decades of consolidation and restructuring, most notably the 2011 AMR bankruptcy and the 2013 merger with US Airways.
1920s–1930s: Built from a patchwork of small airmail operators that consolidated into American Airways.
1978: U.S. airline deregulation pushes American to embrace hub-and-spoke flying and yield management.
2011: AMR Corporation files for bankruptcy, setting up a strategic reset.
2013: AMR and US Airways combine to form American Airlines Group Inc.
2020–2021: Pandemic shock collapses demand; American raises emergency liquidity, exiting with materially higher leverage.
2023–2025: Traffic rebounds to record revenue levels ($54.6B in 2025), but margins remain thin.
Q1 2026: Revenue grows to $12.5B (+3.5% YoY) while overall operating margins compress to ~1.8%, underscoring the shift toward high-margin loyalty revenue to stabilize profitability.
Revenue Streams: American’s Four Economic Engines
Although American reports a single consolidated airline segment, its revenue base falls into a handful of distinct economic buckets. Scheduled passenger flying still dominates the top line, but loyalty partnerships, ancillary products, and cargo contribute meaningfully to margin and cash generation. Dissecting these revenue streams helps clarify where the business truly earns its keep.
1. Scheduled Passenger Revenue (Core Flying)
Scheduled passenger flying is the backbone of American’s income statement. It is driven by three levers: capacity (available seat miles), load factor (how full the planes are), and yield (revenue per passenger mile). In Q1 2026, Passenger Revenue hit $11.1B (+2.1% YoY). While it provides indispensable scale and network relevance, it is a structurally low-margin, capital-intensive activity. Profitability is highly sensitive to oil prices, wage agreements, and network optimization. American’s current strategy leans heavily into premium cabin demand to lift unit revenue on this large, low-margin base.
2. Loyalty and Co-Branded Credit Cards (The Profit Stabilizer)
Beneath the visible network of planes sits a more abstract but highly profitable engine: the AAdvantage program. American is effectively selling miles, status, and access, monetizing cardholder spend rather than actual transportation. In Q1 2026, Loyalty and Other Revenue jumped to $1.1B (+15.0% YoY). Operating with estimated margins of 50–70%, this capital-light segment is the true margin driver, offsetting the heavy fixed costs of the passenger flying business.
3. Ancillary Revenues
Bags, preferred seating, and optional fees represent a growing, high-margin revenue layer. By moving toward clearer fare families, American is successfully linking ancillaries to loyalty perks (e.g., free bags for elites) while preserving monetization on non‑loyalty, price-sensitive customers.
4. Cargo
Cargo is run largely as an incremental business on top of the passenger network. Leveraging belly space on widebody aircraft, it provides a modest (1-2% of revenue) but capital-light stream with 20-40% incremental margins, minimizing downside risk without requiring large dedicated-fleet investments.

Q1 2026 Revenue Rebalancing Summary
Economic Engine | Q1 2026 Revenue | YoY Change | Implied Margin | Capital Intensity |
Passenger Flying | $11.1B | +2.1% | Low (~1-2%) | High (Aircraft/Fuel/Labor) |
Loyalty & Other | $1.1B | +15.0% | High (>50-70%) | Low (Digital/Partnerships) |
Cargo | ~$0.2B | Stable | Moderate (20-40%) | Low (Belly space leverage) |
Under the Hood: Q1 Cash and Costs
While the topline revenue growth looks healthy, the micro-economics tell a more complex story. The impressive $1.5 billion debt paydown was heavily fueled by seasonal working capital—specifically, the Q1 spike in Air Traffic Liability as travelers booked summer flights.
Furthermore, the margin compression to 1.8% reveals a negative spread between unit revenues (TRASM) and unit costs (CASM-ex). American is struggling to raise fares fast enough to cover its newly minted, high-cost labor contracts. The saving grace? The premium cabins, which continue to outpace Main Cabin growth, proving that American's pivot toward high-yielding, less price-sensitive travelers is the only thing keeping the core flying business afloat.
Operational and Network Risks – And How American Manages Them
1. Hub Concentration and Reliability
American’s fortress hubs at Dallas/Fort Worth (DFW), Charlotte, and Miami are profit centers but also points of failure. To reduce vulnerability, American is redesigning DFW’s bank structure—moving from nine tightly packed banks to thirteen evenly spread across the day. This trades a bit of theoretical utilization for more reliable operations, cutting down delay propagation for the roughly 100,000 daily connecting customers at DFW.

2. Labor and Cost Inflation
With an overall operating margin of just ~1.8% in early 2026, the company is highly exposed to wage step-ups. Management’s response mixes long-term contracts (locking in labor peace), schedule smoothing, and technology investments. The messaging prioritizes "running a reliable airline" as a foundation for premium revenue, rather than chasing maximum short-term capacity.
3. Fuel Volatility and Margin Squeeze
Jet fuel remains the most unpredictable variable in American’s cost structure. Because the core passenger flying business operates with razor-thin margins, exposure to rising global oil prices is a constant threat to free cash flow generation. While American utilizes hedging strategies to cap its exposure to sudden oil spikes, hedging is an imperfect science. To combat this structurally, management's primary defense is fleet modernization. By aggressively retiring older aircraft and taking delivery of next-generation narrowbodies and widebodies, American is working to lower its structural fuel burn per seat-mile by 10–15% per generation. However, if rising fuel costs outpace these efficiency gains, it directly threatens the free cash flow needed to hit their aggressive 2026 deleveraging targets.
Balance Sheet and Financial Risks – The Deleveraging Playbook
American still carries the highest leverage among the Big Three. This magnifies normal airline volatility: small swings in revenue or fuel translate into outsized changes in free cash flow.
Management’s core mitigation is an aggressive deleveraging plan. After bringing total debt down from a pandemic peak of $50B+ to ~$36.5B at the end of 2025, American utilized its free cash flow generation in Q1 2026 to pay down an additional $1.5 billion in principal. This keeps the company well ahead of schedule on its target to push total debt below $35 billion.
The Deleveraging Path
2021: ~$50B+ (Peak Leverage)
2025: ~$36.5B (Current Status)
Q1 2026: $1.5B Debt Reduction Achieved
2026 Target: <$35B (Accelerated Goal)
2027+ Target: Structural Repair / Investment Grade metrics

Conclusion: The Bull vs. Bear Case
Taken together, American Airlines looks less like a single airline and more like a bundle of four distinct economic engines strapped to the same balance sheet. The scheduled flying business provides indispensable scale but remains exposed to macro shocks. Meanwhile, loyalty, ancillaries, and cargo supply the higher-return cash flows that increasingly determine whether the group creates value.
Against a backdrop of thin margins and elevated leverage, management’s strategy of prioritizing premium loyalty economics and disciplined deleveraging is a rational attempt to bend the curve in shareholders’ favor. Whether that proves enough will ultimately be judged by American’s ability to sustain acceptable returns on capital across a full cycle in an industry that rarely rewards optimism for long.


Comments